guide
How to capture console logs in Chrome
Console errors are often the fastest route to the cause of a web bug. This guide shows how to open the Chrome Console, keep messages across page loads, save the console log to a file, and share errors in a form developers can act on.
Quick answer
How to capture console logs in Chrome
Press Ctrl+Shift+J (Windows, Linux) or Cmd+Option+J (Mac) to open the Console. Open Console settings (gear icon) and check Preserve log. Reproduce the problem, then right-click an empty area of the Console and choose Save as... to download a .log file with every message.
What the browser console shows
The Console in Chrome DevTools collects messages from the page: console.log output from the site's code, warnings, uncaught JavaScript errors with stack traces, failed resource loads, CORS and Content Security Policy violations, and deprecation notices. When a button does nothing or a page renders blank, the answer is usually a red error here.
| Message level | Looks like | Include in a bug report? |
|---|---|---|
| Error | Red, with a stack trace | Always |
| Warning | Yellow | If it appears when the bug happens |
| Info | Default color | Only if it relates to the failing action |
| Verbose | Hidden by default | Only when a developer asks for it |
How to capture console logs, step by step
- Open the Console. Press Ctrl+Shift+J on Windows and Linux or Cmd+Option+J on Mac. You can also press F12 and click the Console tab.
- Turn on Preserve log. Click the gear icon (Console settings) in the top-right of the Console panel and check Preserve log, so messages are not cleared when the page reloads or navigates.
- Show all levels. In the Default levels dropdown, make sure Errors, Warnings and Info are checked. Add Verbose only if asked.
- Clear the Console. Click the clear icon or press Ctrl+L (Cmd+K on Mac) so the log only contains the problem.
- Reproduce the bug. Repeat the exact steps that cause the problem while the Console stays open.
- Expand the errors. Click the arrow next to each red error to reveal its stack trace, which also gets included when you save.
- Save the log. Right-click an empty area of the Console and choose Save as.... Chrome downloads a plain-text
.logfile named after the site. - Share it with context. Attach the file to your bug report along with the URL, the time and what you clicked.
To share a single error instead of the whole log, right-click the message and choose Copy console message, then paste it into your ticket inside a code block.
Other ways to export a console log
- Filter first, then save. Type a word in the Console filter box or select only Errors before using Save as... to keep the file focused.
- Show timestamps. In DevTools Settings > Preferences > Console, enable Show timestamps so each message has a time you can match to server logs.
- Capture from the moment you run it. For long sessions, you can wrap the console methods and copy the results with the DevTools
copy()helper:
// Paste in the Console to start collecting messages
// (only captures what is logged after you run this).
const captured = [];
['log', 'info', 'warn', 'error'].forEach((level) => {
  const original = console[level];
  console[level] = (...args) => {
    captured.push({ level, time: new Date().toISOString(), args: args.map(String) });
    original.apply(console, args);
  };
});
window.addEventListener('error', (e) =>
  captured.push({ level: 'uncaught', time: new Date().toISOString(), args: [e.message] })
);
// Later, reproduce the bug, then run:
copy(JSON.stringify(captured, null, 2));
That snippet only records messages logged after you run it and is lost on reload, so it is a debugging aid, not a replacement for Preserve log.
Reading common console errors
You do not need to be a developer to add useful context. Recognizing a few frequent errors helps you judge whether the message is related to your bug and what else to attach.
| Error text starts with | Typical cause | Also attach |
|---|---|---|
Uncaught TypeError: Cannot read properties of undefined | Code expected data that was missing | The failing API request, if any |
Failed to load resource: the server responded with a status of 500 | A server error on a request | A HAR file or the request details |
Access to fetch ... has been blocked by CORS policy | Server does not allow requests from this origin | The page URL and the blocked request URL |
Refused to load ... because it violates the Content Security Policy | A script, font or image is blocked by site security rules | The exact blocked URL from the message |
Uncaught (in promise) | An async operation failed and nothing handled it | The steps that triggered it |
ChunkLoadError or Loading chunk failed | A new release was deployed while the tab was open | Whether a hard refresh fixes it |
Not every red message is your bug. Errors from browser extensions (URLs starting with chrome-extension://) and third-party analytics scripts are common noise. Retest in an incognito window with extensions disabled to rule them out, and mention that you did in your report.
The Issues panel (open it from the Console toolbar or the Command Menu) groups related problems such as cookie, mixed content and accessibility warnings. If a developer asks for "issues" rather than console errors, that is where to look.
Common mistakes when sharing console errors
- Screenshots of the Console. Developers cannot search or copy text from an image, and stack traces are usually cut off. Save or copy the text instead.
- Opening the Console too late. Messages logged before DevTools was open may be missing. Open it, then reload and reproduce.
- Missing Preserve log. A redirect after a failed login clears the Console and the evidence with it.
- Collapsed errors. Expand stack traces before copying so file names and line numbers come along.
- Leaking data. Some apps log user details or tokens. Skim the file and remove anything sensitive before attaching it.
- No network context. A console error such as "Failed to fetch" makes more sense next to the failing request. Pair it with a HAR file.
The faster way: Bugmark
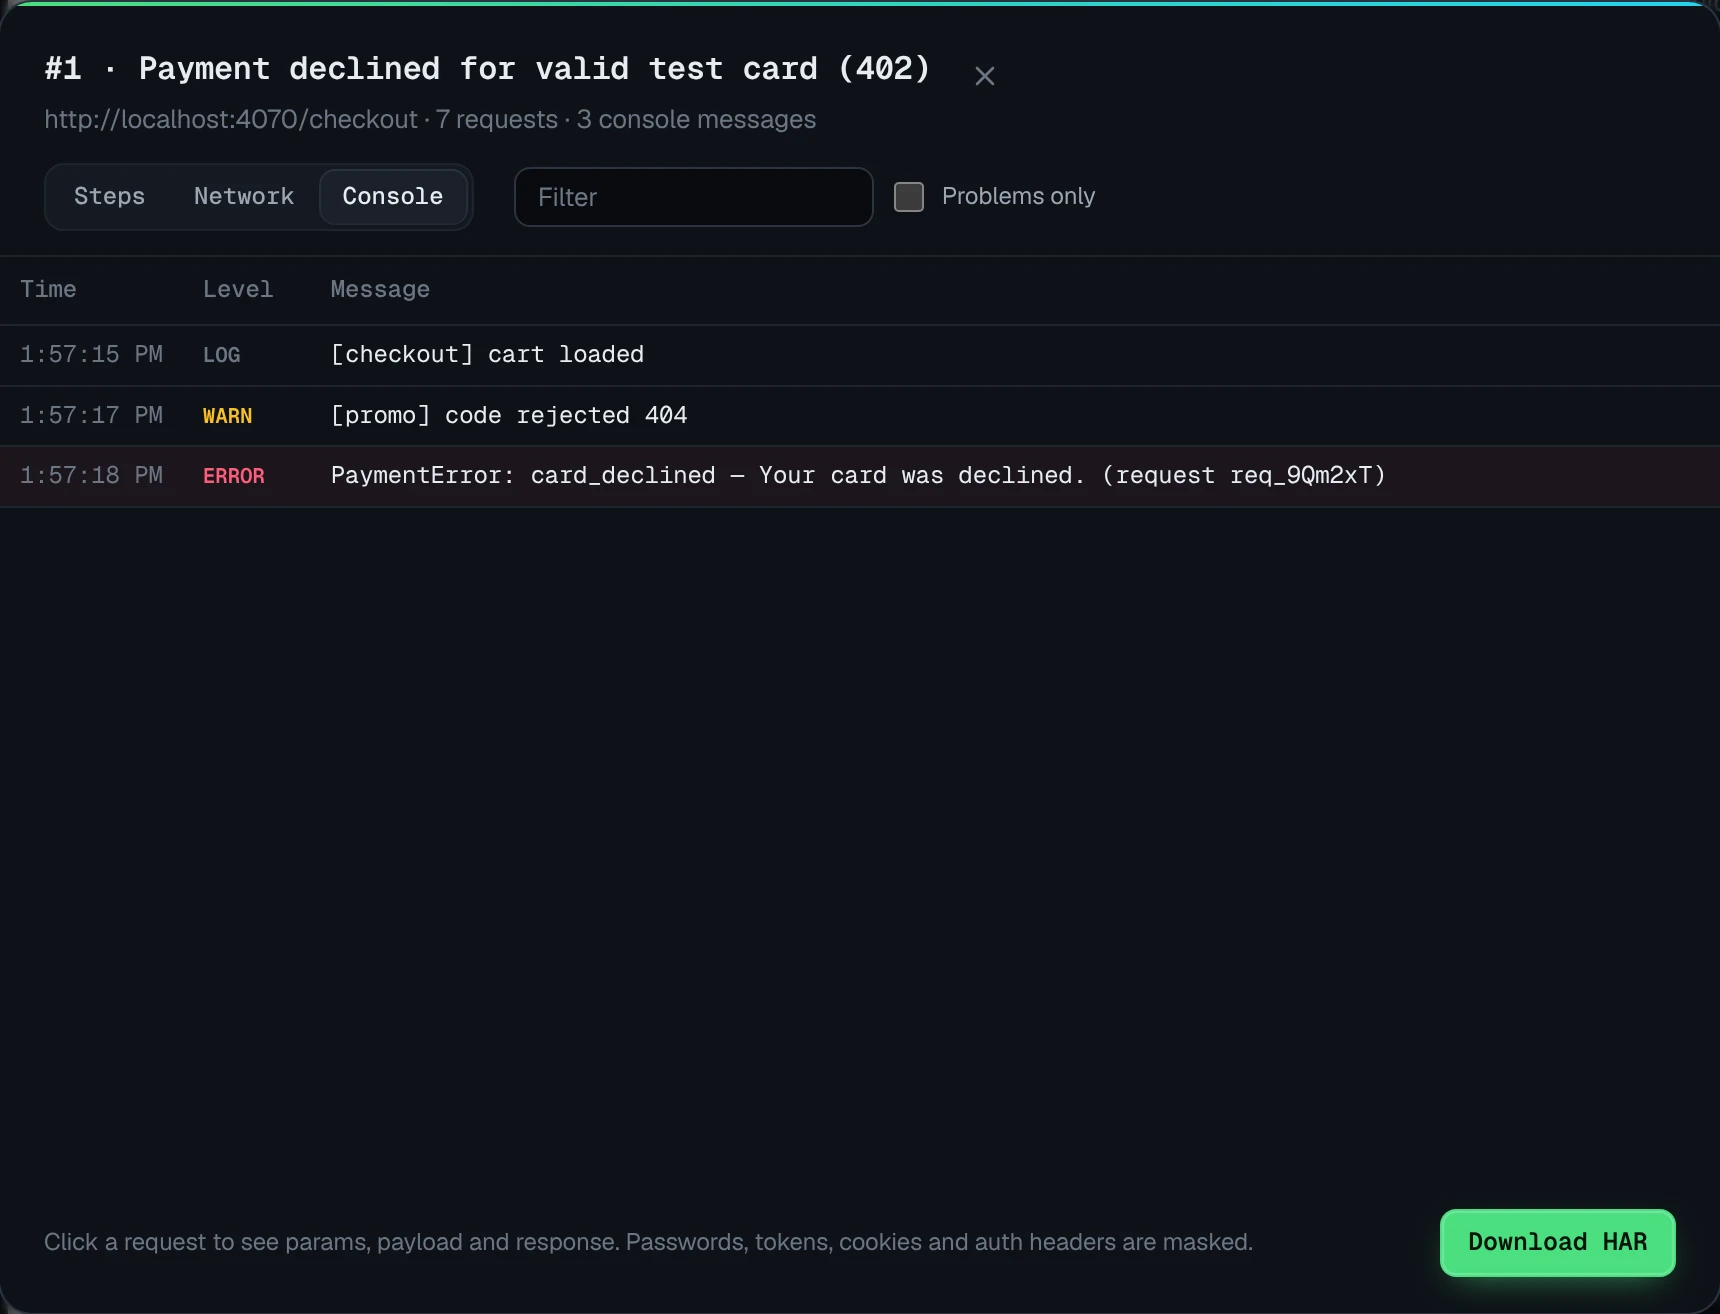
Asking every tester or client to open DevTools, set Preserve log and save a file rarely works. Bugmark is a free Chrome extension that keeps console context automatically, so it is attached to the bug report the moment anyone captures a screenshot or recording.
- Captures the last 150 console messages, plus JavaScript errors and unhandled promise rejections.
- No need to open DevTools before the bug happens.
- The same capture includes the network log, recorded steps to reproduce and environment details.
- Export as Markdown, CSV, a self-contained HTML report or PDF, or create a GitHub issue with the console errors included.
Logs stay in your browser until you choose to export them. See how to write a bug report for what else to include. Add Bugmark to Chrome — free
How to capture console logs in Chrome
- 1
Open the Console
Press Ctrl+Shift+J on Windows and Linux or Cmd+Option+J on Mac.
- 2
Enable Preserve log
Click the gear icon in the Console panel and check Preserve log.
- 3
Clear existing messages
Click the clear icon so only messages from the problem are captured.
- 4
Reproduce the bug
Repeat the steps that cause the problem while the Console is open.
- 5
Expand errors
Click the arrow beside each error to reveal its stack trace.
- 6
Save the log
Right-click an empty area of the Console and choose Save as to download a .log file.
Frequently asked questions
How do I save the Chrome console log to a file?
Open DevTools with Ctrl+Shift+J or Cmd+Option+J, reproduce the problem, then right-click any empty area of the Console and choose Save as. Chrome saves a plain-text .log file containing the messages currently shown. Turn on Preserve log first if the problem involves a reload or redirect.
Why does the console clear when the page reloads?
By default, Chrome clears the Console on every navigation so each page starts fresh. To keep messages across reloads and redirects, open Console settings with the gear icon and check Preserve log. This is essential when capturing errors during login flows, form submissions or checkouts that move you to a new page.
How do I share a console error with a developer?
Copy the text rather than taking a screenshot. Right-click the error and choose Copy console message, or save the whole log with Save as. Paste the error into your bug report inside a code block, expand the stack trace first, and include the page URL, time and the steps that triggered it.
Can console logs contain sensitive information?
Yes. Some applications log user IDs, email addresses, API responses or even tokens during development. Before attaching a console log to a ticket or sending it to a vendor, skim it for personal data and credentials and remove anything that should not be shared outside your team.
How do I see console logs on a mobile device?
For Android, connect the device over USB, enable USB debugging, and open chrome://inspect on your desktop Chrome to inspect the tab and view its Console. For a quick check of responsive issues, you can also use the DevTools device toolbar on desktop, which emulates mobile viewports.
Try Bugmark free — no account needed
- Screenshots & screen recording
- Console & network logs
- Steps to reproduce
- GitHub issues & reports