guide
How to capture a HAR file in Chrome
Support teams ask for a HAR file when they need to see exactly what your browser sent and received. Here is how to record and export one from Chrome DevTools in about two minutes, and how to keep your cookies and tokens out of it.
Quick answer
How to capture a HAR file in Chrome
Open the page, press F12 (or Cmd+Option+I on Mac) and select the Network panel. Check Preserve log, reload the page and reproduce the problem. Then click the download icon, Export HAR (sanitized)..., and save the .har file. Sanitized export leaves out cookies and authorization headers.
What is a HAR file?
A HAR (HTTP Archive) file is a JSON file that records every network request a browser tab made while it was being recorded: the URL, method, status code, request and response headers, timing, and often the response body. Chrome, Edge, Firefox and Safari can all export it, and DevTools can import it again for analysis.
Developers and support engineers use HAR files to diagnose failed API calls, slow page loads, redirects, CORS problems, and login or checkout errors they cannot reproduce on their own machines.
Privacy warning
A HAR file can contain session cookies, authorization tokens, form data and personal information. Anyone who has an unsanitized HAR file may be able to act as you on that site. Use the sanitized export, and only send HAR files to people you trust through a secure channel.
How to capture a HAR file in Chrome, step by step
- Open the page where the problem happens. If possible, start from the page just before it.
- Open DevTools. Press F12 or Ctrl+Shift+I on Windows and Linux, Cmd+Option+I on Mac, or right-click the page and choose Inspect.
- Select the Network panel. If you do not see it, click the
>>overflow arrow in the DevTools tab bar. - Check Preserve log in the Network toolbar so requests are kept when the page reloads or redirects. Optionally check Disable cache to record what a first-time visitor would load.
- Clear old entries with the clear icon (a circle with a line through it) so the file only contains the problem.
- Confirm recording is on. The record button at the top left of the panel should be red. Click it if it is gray.
- Reproduce the problem. Reload the page and repeat the exact steps that cause the bug until you see the error.
- Export the HAR file. Click the download icon (Export HAR (sanitized)...) in the Network toolbar, or right-click any request and choose Save all as HAR (sanitized). Choose a location and save the .har file.
The download icon exports everything currently listed. If you have a filter active (for example Fetch/XHR), right-click and use the "listed" save option to export only the filtered requests.
Sanitized vs. with sensitive data
Current Chrome exports HAR files sanitized by default. Sanitized files leave out Cookie, Set-Cookie and Authorization headers. If a developer genuinely needs them, you can enable Settings > Preferences > Network > Allow to generate HAR with sensitive data, which adds an Export HAR (with sensitive data)... option.
| Export option | Includes cookies and auth headers | Use it when |
|---|---|---|
| Export HAR (sanitized)... | No | Sending to vendor support or anyone outside your team (default choice) |
| Export HAR (with sensitive data)... | Yes | Debugging your own app locally, when a session issue must be analyzed |
Sanitizing does not remove everything. Tokens in URL query strings, request payloads (such as a login form) and response bodies stay in the file. Search the file before sharing it:
# Quick check for secrets before you share a HAR file (macOS / Linux)
grep -Eio '"name": *"(cookie|set-cookie|authorization|x-api-key)"' network.har | sort | uniq -c
grep -Eio '(access_token|refresh_token|id_token|password|session)[^,]{0,40}' network.har | head
When you are done, log out of the site or revoke the session if you shared a file that might contain live credentials.
What support looks for in a HAR file
Knowing what the recipient will check helps you capture the right thing. Open the file in DevTools (drag it onto the Network panel) and look for these signals before you send it:
| Signal | Where to find it | What it usually means |
|---|---|---|
| Status 4xx | Status column, shown in red | Bad input, expired session (401), missing permission (403) or wrong URL (404) |
| Status 5xx | Status column, shown in red | The server failed; the response body often contains the error |
| (failed) or (blocked) | Status column | CORS, an ad blocker, a network drop or a Content Security Policy rule |
| Long waiting time | Timing tab, Waiting for server response | Slow backend or database query |
| Redirect loops | Many 301 or 302 rows to the same URLs | Misconfigured login, cookies or HTTPS settings |
If you already know which request fails, mention its URL and the time you reproduced the problem in your message. That saves the reader from scanning hundreds of rows. Pair the file with a clear written report using our bug report template.
The same flow works in other browsers. In Firefox, open the Network panel, reproduce the issue, then use the gear menu and choose Save All As HAR. In Safari, enable the Develop menu in Settings > Advanced, open Web Inspector, go to Network and click Export. Edge, Brave and Arc use Chrome DevTools, so the steps above apply unchanged.
Common HAR capture mistakes
- Opening DevTools after the problem. The Network panel only records while it is open. Open it first, then reproduce.
- Forgetting Preserve log. Without it, a redirect or reload wipes the requests that showed the error.
- Capturing too much. A long browsing session produces a huge file that is hard to read. Clear the log and record only the failing flow.
- Sharing unsanitized files. Never post a HAR file in a public forum, GitHub issue or chat channel without checking it for secrets.
- Sending only the HAR. Include the time it happened, what you clicked and a screenshot. Console errors often explain the failure, so see how to capture console logs too.
Received a HAR file? Open DevTools on any tab, go to Network, and drag the .har file into the request list (or use the Import HAR upload icon) to inspect it just like a live recording.
The faster way: Bugmark
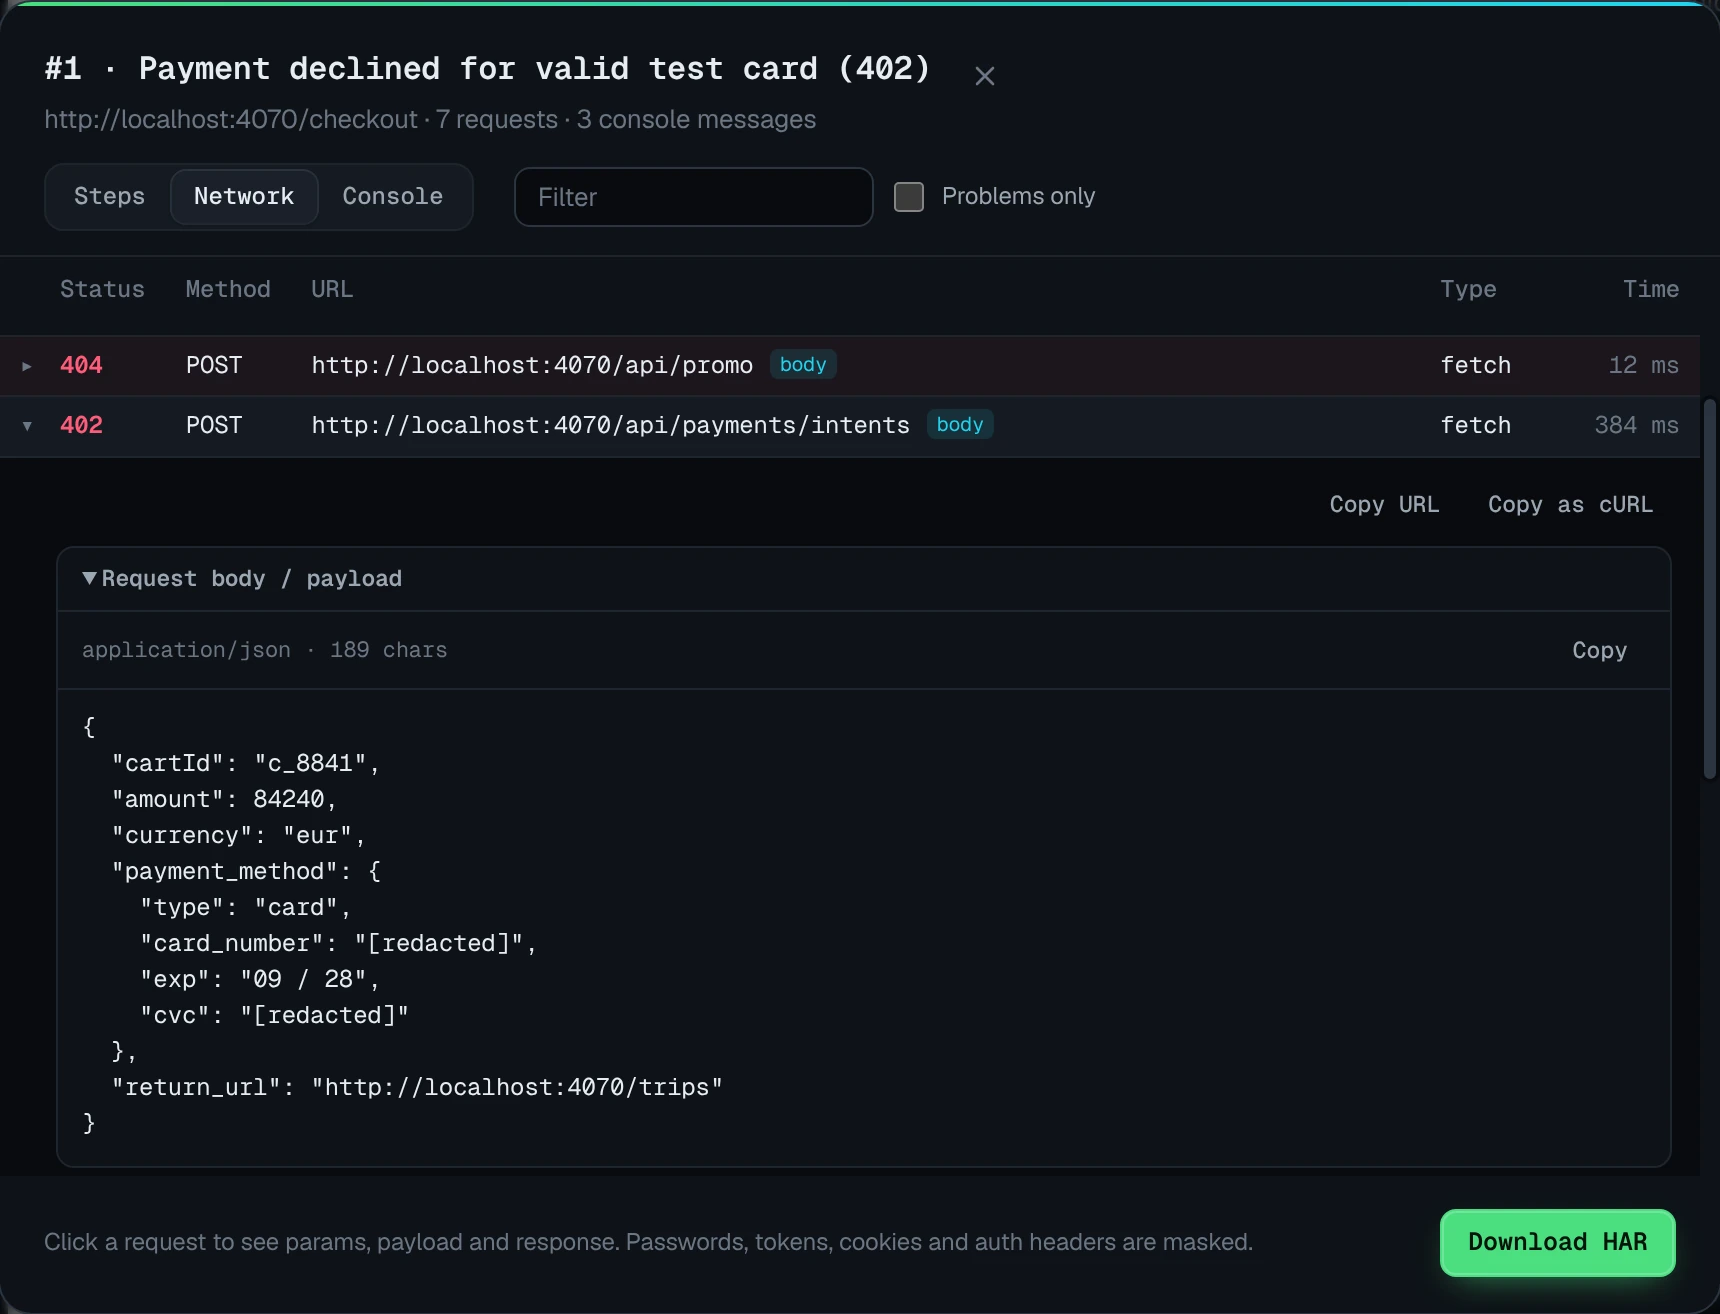
The DevTools method works, but you have to remember to open it before the bug happens, and the file still needs checking for secrets. Bugmark is a free Chrome extension that keeps a rolling network log for the tab, so the failing request is already there when you capture a bug.
- Records the last 150 requests (fetch, XHR and resources) with method, URL, status and timing.
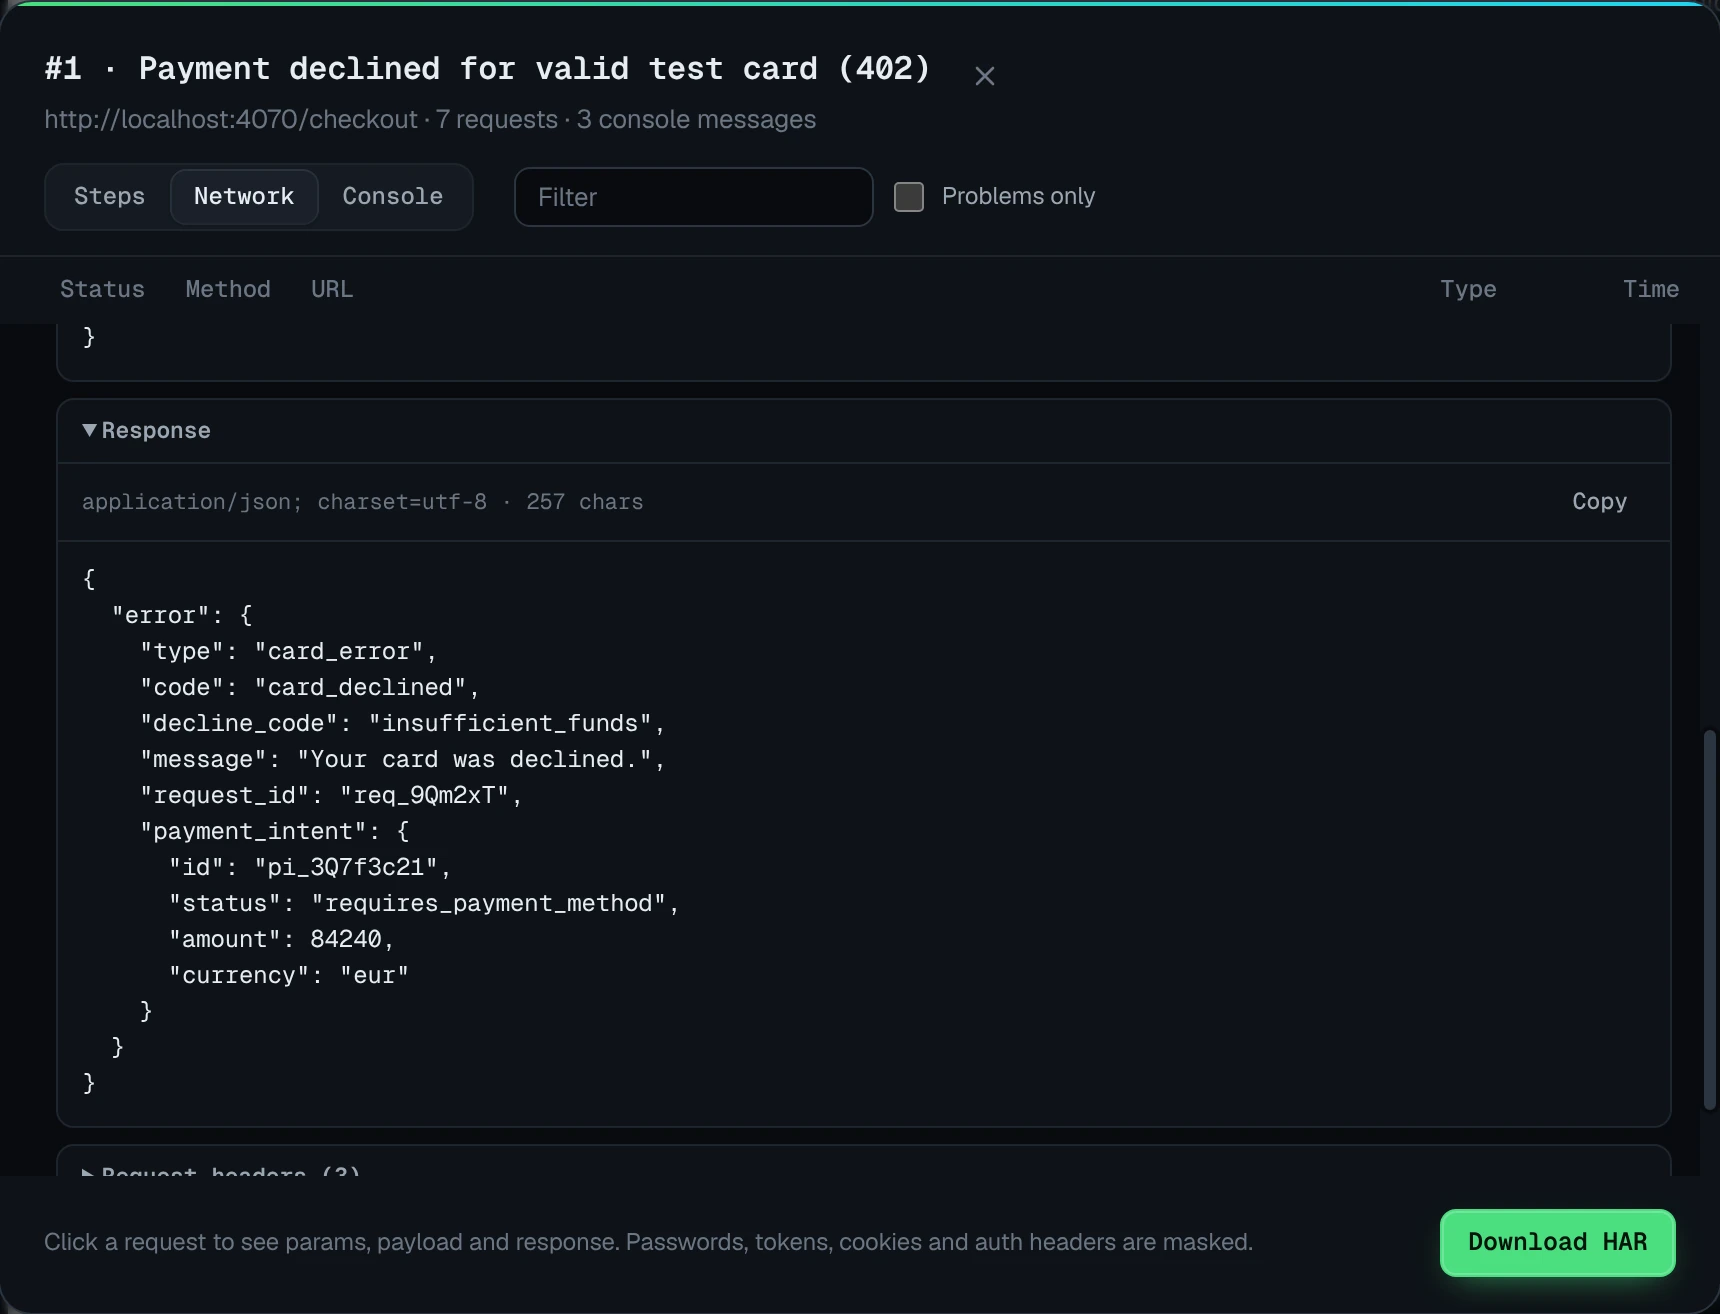
- For the 60 most recent fetch/XHR calls, keeps query params, request headers and payload, response headers and response body.
- Masks secrets before saving: passwords, tokens, API keys, session IDs, card numbers and
Authorization/Cookieheaders become[redacted]. - Filter to failures, Copy as cURL, or Download HAR and open it in Chrome DevTools.
- Attaches the screenshot, console errors and steps to reproduce to the same report.
Data stays in your browser until you export it. Add Bugmark to Chrome — free
How to capture a HAR file in Chrome
- 1
Open DevTools
On the affected page press F12, Ctrl+Shift+I or Cmd+Option+I to open Chrome DevTools.
- 2
Select the Network panel
Click the Network tab, using the overflow arrow if it is hidden.
- 3
Enable Preserve log
Check Preserve log so requests survive reloads and redirects, and clear old entries.
- 4
Check recording is on
Make sure the record button at the top left of the Network panel is red.
- 5
Reproduce the problem
Reload the page and repeat the steps that trigger the issue.
- 6
Export the HAR file
Click the download icon, Export HAR (sanitized), and save the .har file.
- 7
Review before sharing
Search the file for tokens or personal data and share it only over a private channel.
Frequently asked questions
What is a HAR file used for?
A HAR file records the network activity of a browser tab, including request URLs, headers, status codes, timing and response content. Support and engineering teams use it to diagnose failed API calls, slow loading, redirects, login problems and other issues that only happen on a customer's machine and cannot be reproduced internally.
Is it safe to share a HAR file?
Only with care. Chrome's default sanitized export removes cookies and authorization headers, but URLs, form submissions and response bodies can still contain tokens or personal data. Share it only with people you trust over a private channel, never post it publicly, and log out or revoke sessions afterward if you are unsure.
Why is my HAR file empty?
DevTools only records network requests while the Network panel is open and recording. If you opened DevTools after the page loaded, the requests were never captured. Make sure the record button is red, check Preserve log, reload the page and reproduce the problem again before exporting.
How do I open a HAR file in Chrome?
Open DevTools on any tab, select the Network panel, and drag the .har file onto the request list, or click the Import HAR upload icon in the Network toolbar. Chrome displays the requests as if they had been recorded live, so you can inspect headers, timing and responses.
Can I capture a HAR file in Edge or Brave?
Yes. Edge, Brave, Arc and other Chromium browsers use the same DevTools, so the steps are identical: open DevTools, select Network, enable Preserve log, reproduce the problem and use the export icon to save the HAR file. Menu labels may differ slightly between browser versions.
Try Bugmark free — no account needed
- Screenshots & screen recording
- Console & network logs
- Steps to reproduce
- GitHub issues & reports