web developer tools
Web developer tools that bring DevTools context into every bug report
Chrome DevTools is excellent when the bug is on your screen. Bugmark covers the other case: the bug happened in someone else's browser, and you need the console, the network calls and the element styles they had at that moment.
The gap between DevTools and the bug report
DevTools assumes the person with the bug is the person who knows how to open DevTools. In practice, the bug is found by a designer on a tablet breakpoint, a PM clicking through staging, or a support agent following a customer's description. By the time a developer opens the Network panel, the failing request is long gone and the console is clean.
Bugmark is a set of front-end developer tools packaged for the person reporting the problem. It records the same signals you would look at yourself and freezes them into a report, so you start from evidence rather than a reproduction attempt.
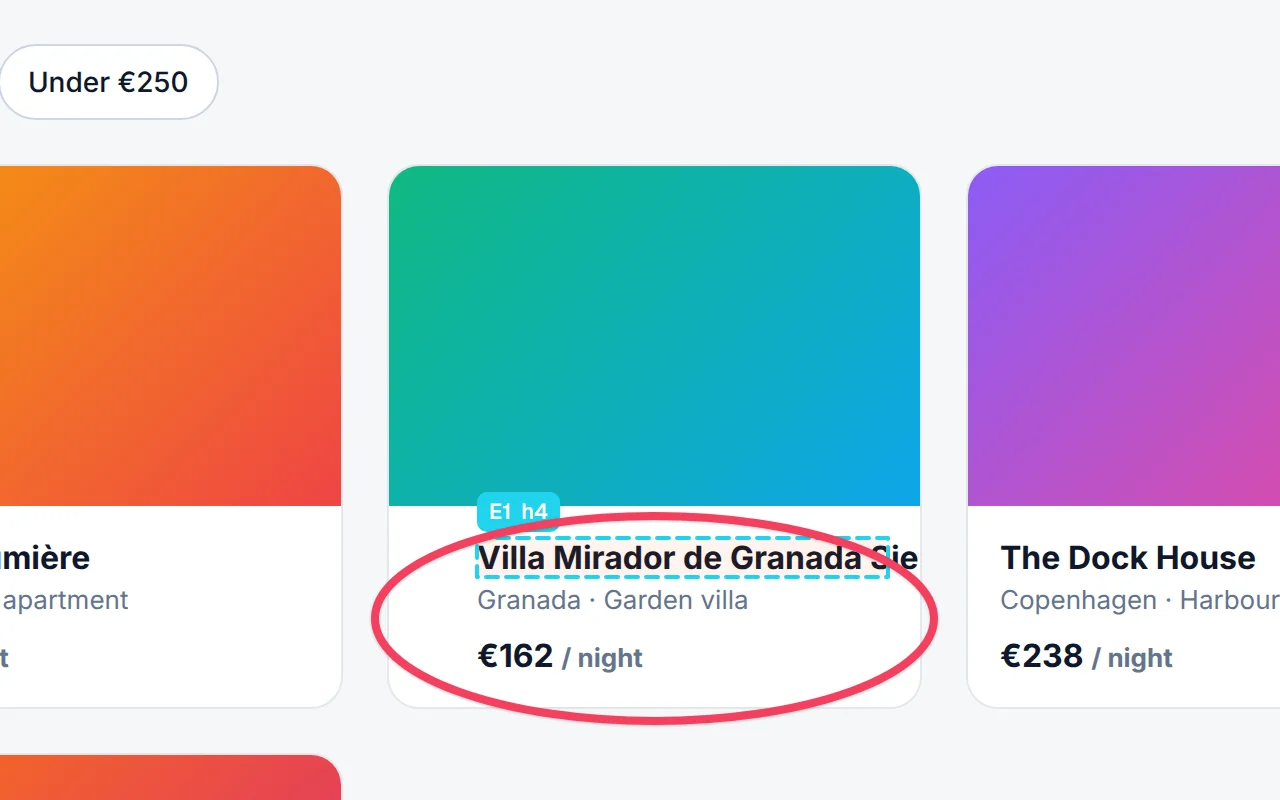
Consider a common case: a designer reports that a price label is truncated on the product page. In DevTools terms you want the element's computed width and font, the viewport, and whether the price came back from the API longer than expected. Normally that means three follow-up questions. With a Bugmark capture it means opening one report.
The developer toolkit inside each capture
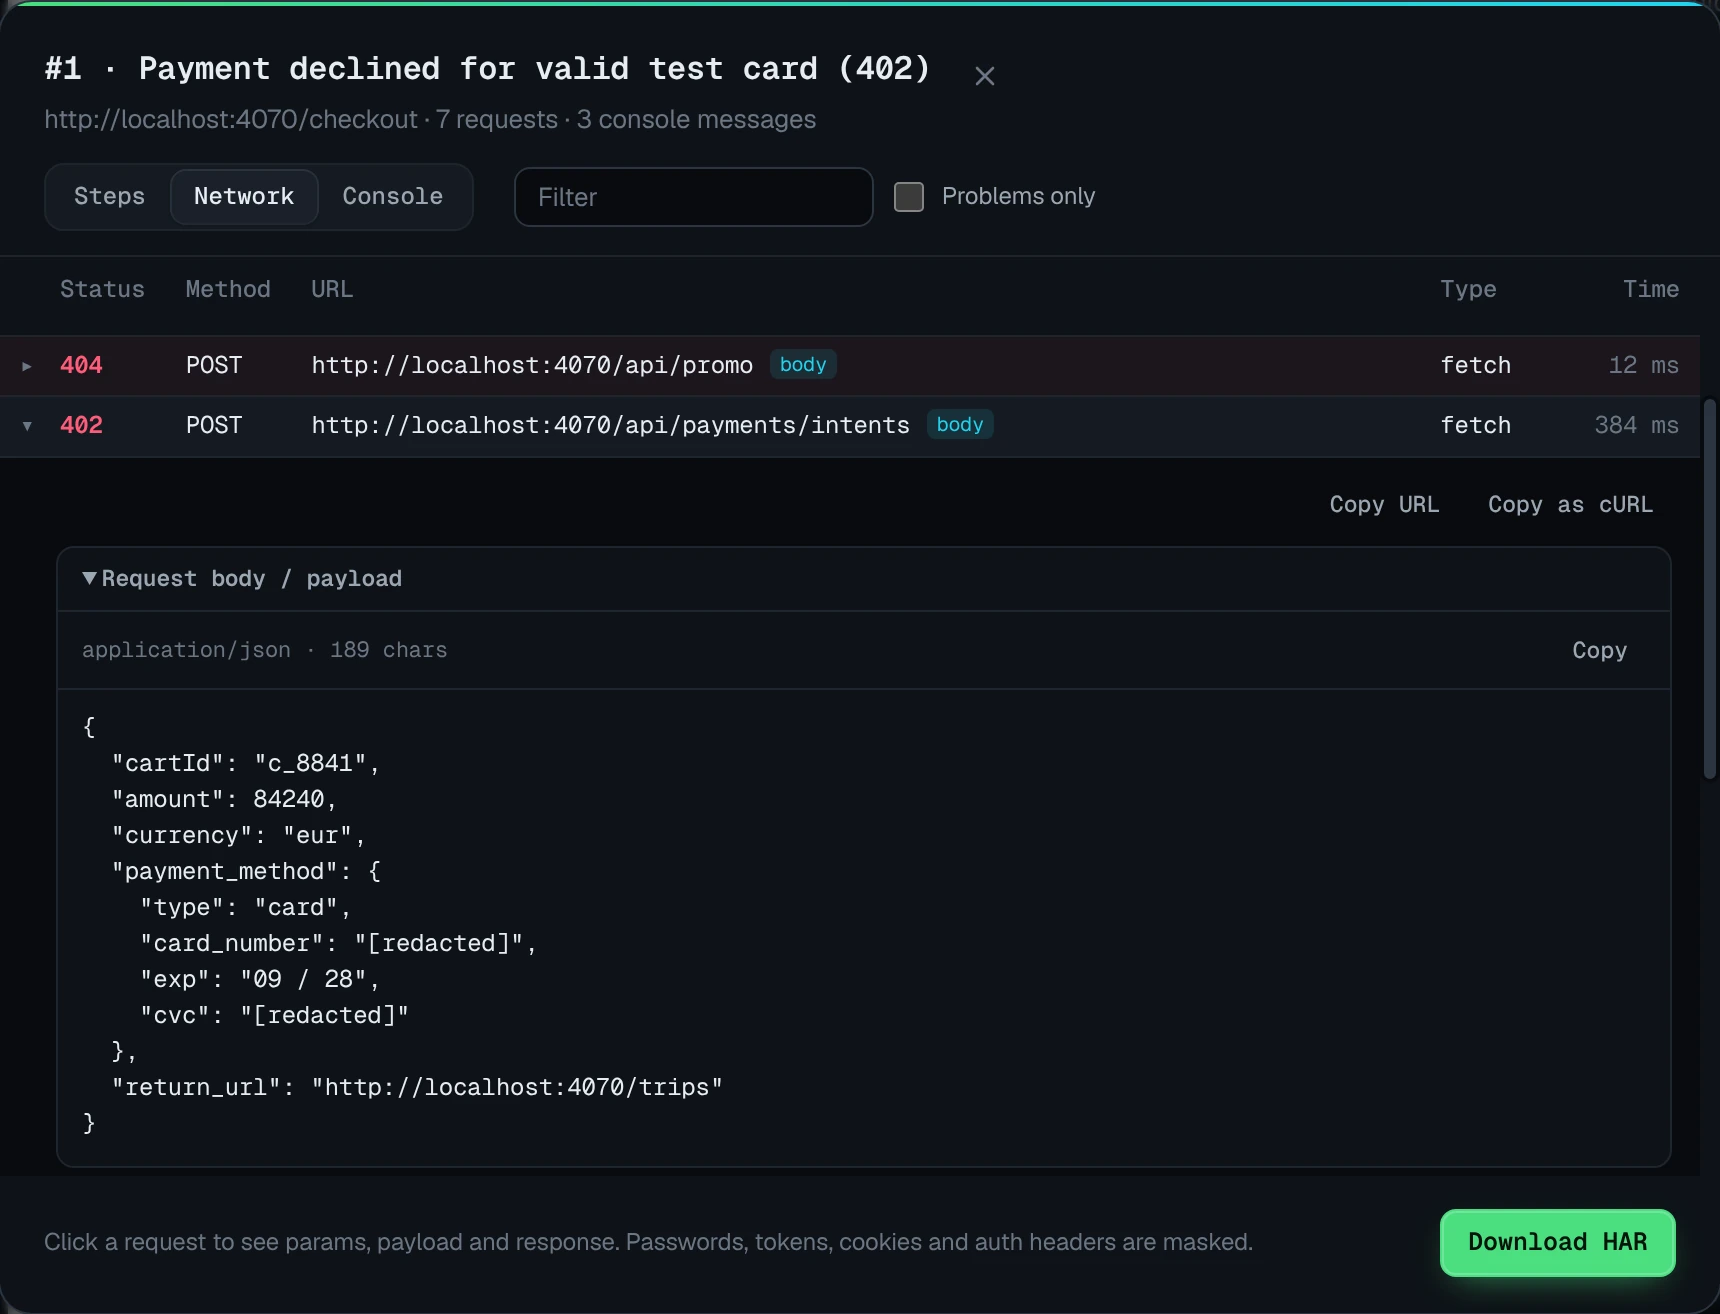
- Network log with bodies — the last 150 requests (fetch, XHR and resources) with method, URL, status and timing. For the 60 most recent fetch/XHR calls you also get query params, request headers, the request payload (JSON, form data,
FormDatafields, up to 16 KB), response headers and the response body (up to 32 KB). - Copy as cURL — replay any captured request from your terminal against a local or staging API.
- Download HAR — export the log and open it in Chrome DevTools → Network for the tooling you already know.
- Console with uncaught errors — the last 150 messages, including JavaScript errors and unhandled promise rejections that never reach a visible UI.
- Element inspector — click an element to attach its CSS selector, size and computed
font,color,background,padding,margin,border,border-radiusanddisplay. - Environment — browser, OS, viewport, device pixel ratio and scroll position, which settles most “works on my machine” debates.
Bugmark alongside Chrome DevTools
Bugmark doesn't replace DevTools; it hands you a snapshot that you then open in DevTools or your terminal. Here is how the two divide the work:
| Task | Chrome DevTools | Bugmark |
|---|---|---|
| Inspect a request you can reproduce | Network panel, live | Not needed |
| Inspect a request from a reporter | Only if they export a HAR themselves | Captured automatically with payload and response |
| Replay a request | Copy as cURL from the panel | Copy as cURL from the report |
| Set breakpoints and step through code | Sources panel | Not supported |
| Profile performance or memory | Performance and Memory panels | Not supported |
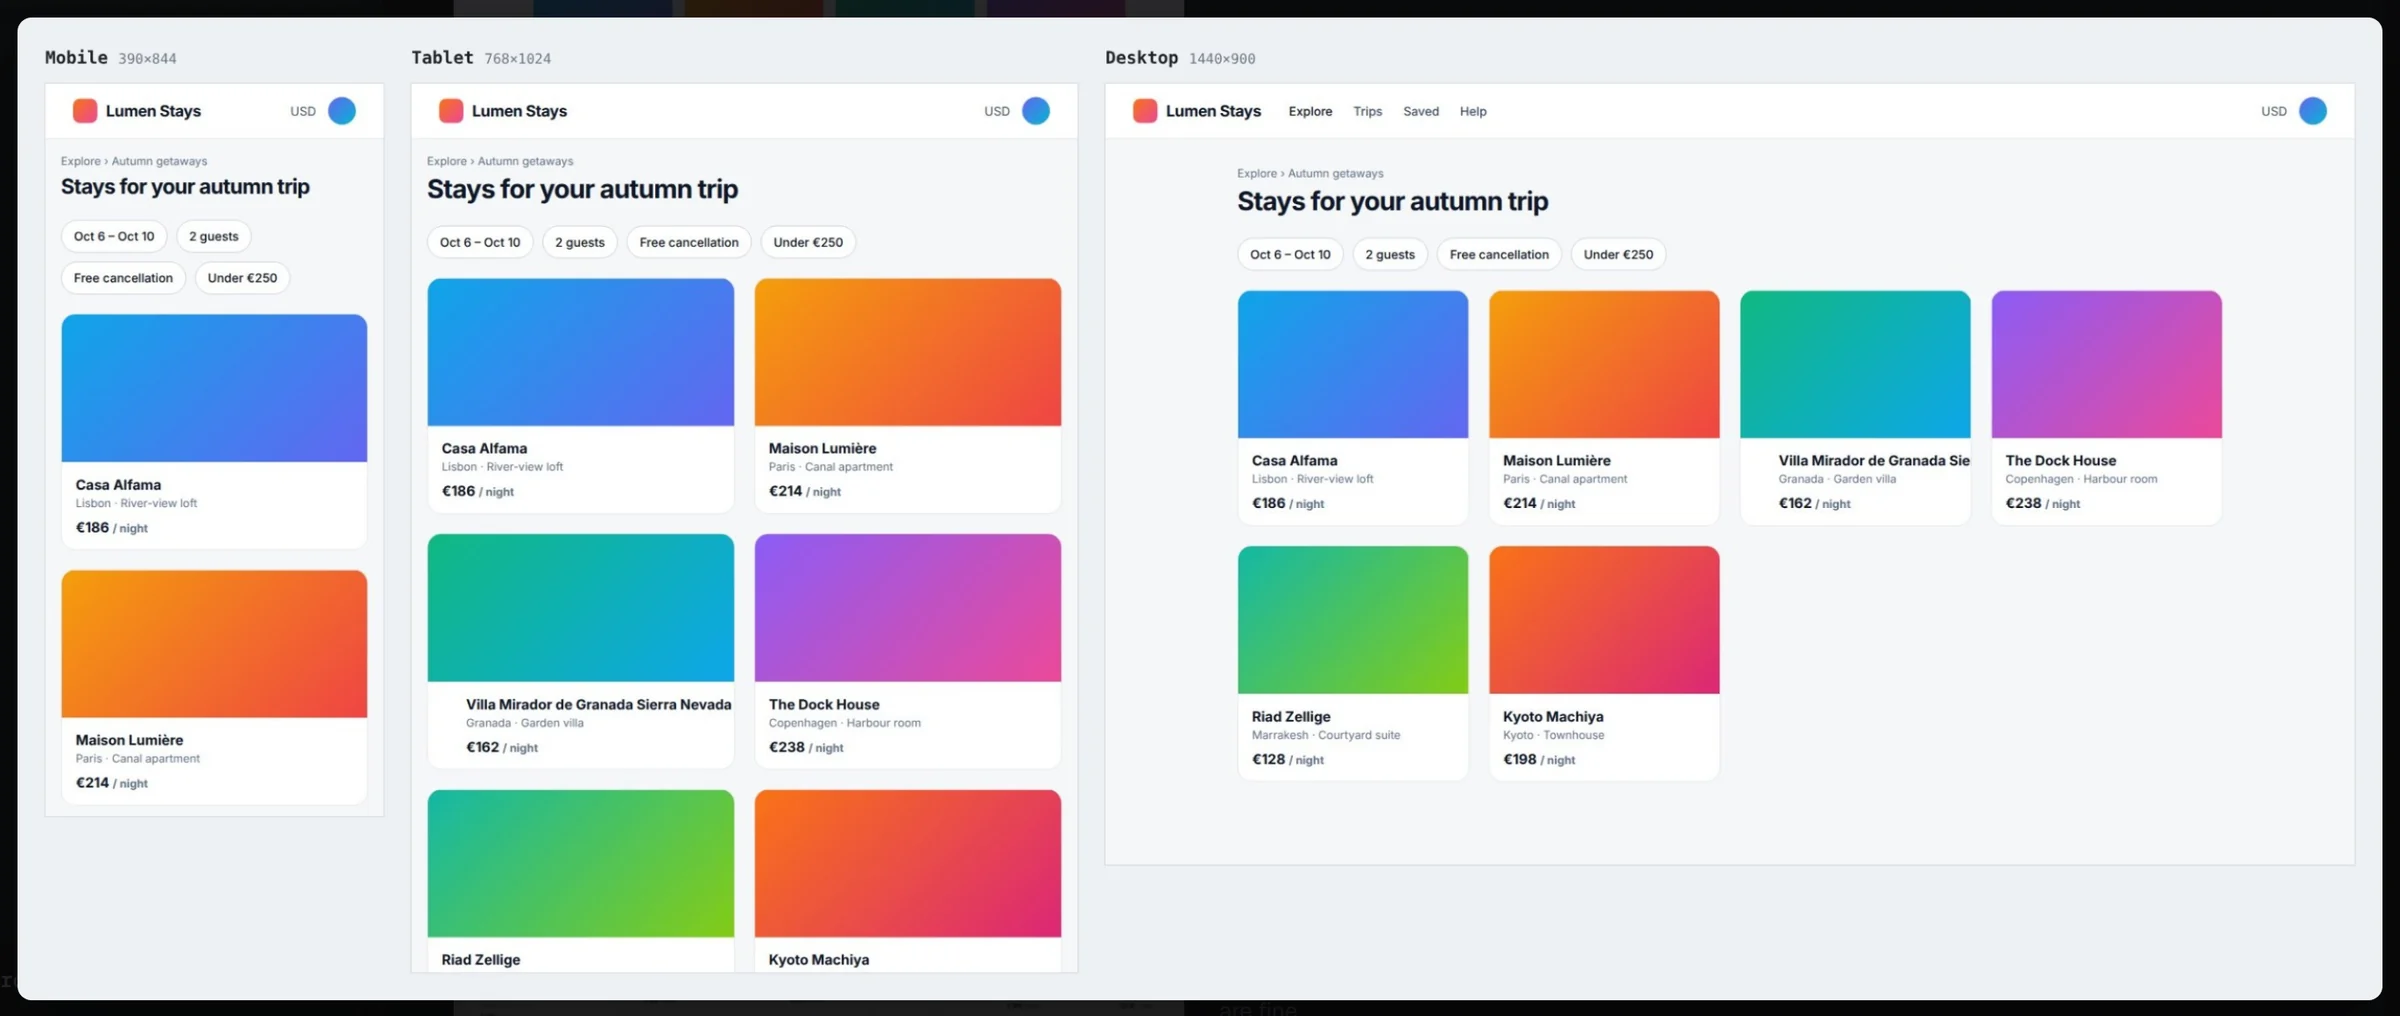
| Check a layout at three widths | Toggle device mode repeatedly | One capture at 390×844, 768×1024 and 1440×900 |
| Record what the user clicked | Recorder panel, if started deliberately | Last 30 actions, always on |
If you just need a HAR from a teammate without installing anything, our guide on how to capture a HAR file in Chrome walks through the manual route.
Responsive checks without toggling device mode
The Mobile · tablet · desktop capture mode uses Chrome device emulation to render the current page at 390×844, 768×1024 and 1440×900, then combines the three into one side-by-side image. It is a quick way to document a breakpoint regression, or to show that a fix holds at every width before closing an issue. For layout fixes, the before/after mode recaptures the page at the same scroll position so the diff is obvious at a glance.
How developers use it day to day
- Share the install page with the people who test your site; setup takes about a minute.
- When they hit a bug, they press ⌥⇧S, mark it up and save. The logs are already attached.
- They create a GitHub issue from the capture, or send you the self-contained HTML report.
- Open the failing request, copy it as cURL or download the HAR, and reproduce against your local API.
- After the fix, add an “after” screenshot to the same report to confirm the change.
Developers also use Bugmark solo: when you notice three problems during a feature walkthrough, capturing each with its logs is faster than writing notes and trying to reproduce later. For a deeper look at tracking down a specific failure, see the debugging tool page, and for the request-level details the network request logger page.
Privacy for the people you ask to report
Asking non-developers to hand over network logs raises fair questions. Bugmark masks passwords, tokens, API keys, session IDs, card numbers and Authorization/Cookie headers with [redacted] in JSON keys, form fields and URL params before anything is saved. Reports stay in the browser's IndexedDB and are not uploaded to Bugmark servers. Optional anonymous usage stats only count feature use and can be turned off in settings. Typed text is never stored in the recorded steps, only which field was used, so a tester filling in a signup form doesn't leak their input into a ticket.
Get the context before you ask for it
Bugmark is free, with no account and every feature unlocked. It runs in Chrome, Edge, Brave and Arc. Add Bugmark to Chrome — free.
Frequently asked questions
What are web developer tools?
Web developer tools are utilities for inspecting and debugging websites: element and style inspectors, console output, network request viewers, device emulation and performance profilers. Chrome ships DevTools built in, and extensions such as Bugmark add workflows on top, like packaging console and network logs into a shareable bug report.
Is Bugmark a replacement for Chrome DevTools?
No. DevTools is where you debug interactively with breakpoints, profiling and live inspection. Bugmark captures a snapshot of console messages, network requests, user steps and element styles at the moment a bug is reported, and lets you export it as a HAR file or cURL command to continue in DevTools or your terminal.
Can I export network requests from a bug report as a HAR file?
Yes. Each Bugmark report has a Download HAR option that exports the captured network log. You can open the file in Chrome DevTools under the Network panel by importing it. Individual requests can also be copied as cURL commands for replaying against your own environment.
Which browsers does Bugmark support?
Bugmark is a Manifest V3 extension for Chrome and Chromium-based browsers, including Microsoft Edge, Brave and Arc. Firefox and Safari are not supported. It installs in a couple of clicks from the Chrome Web Store.
How do I see computed CSS styles in a bug report?
Use Bugmark's element inspector during a capture and click the element in question. The report stores its CSS selector, rendered size and computed styles such as font, color, background, padding, margin, border, radius and display, so the developer sees exact values instead of a description.
Try Bugmark free — no account needed
- Screenshots & screen recording
- Console & network logs
- Steps to reproduce
- GitHub issues & reports