network request logger
A network request logger that attaches API traffic to bug reports
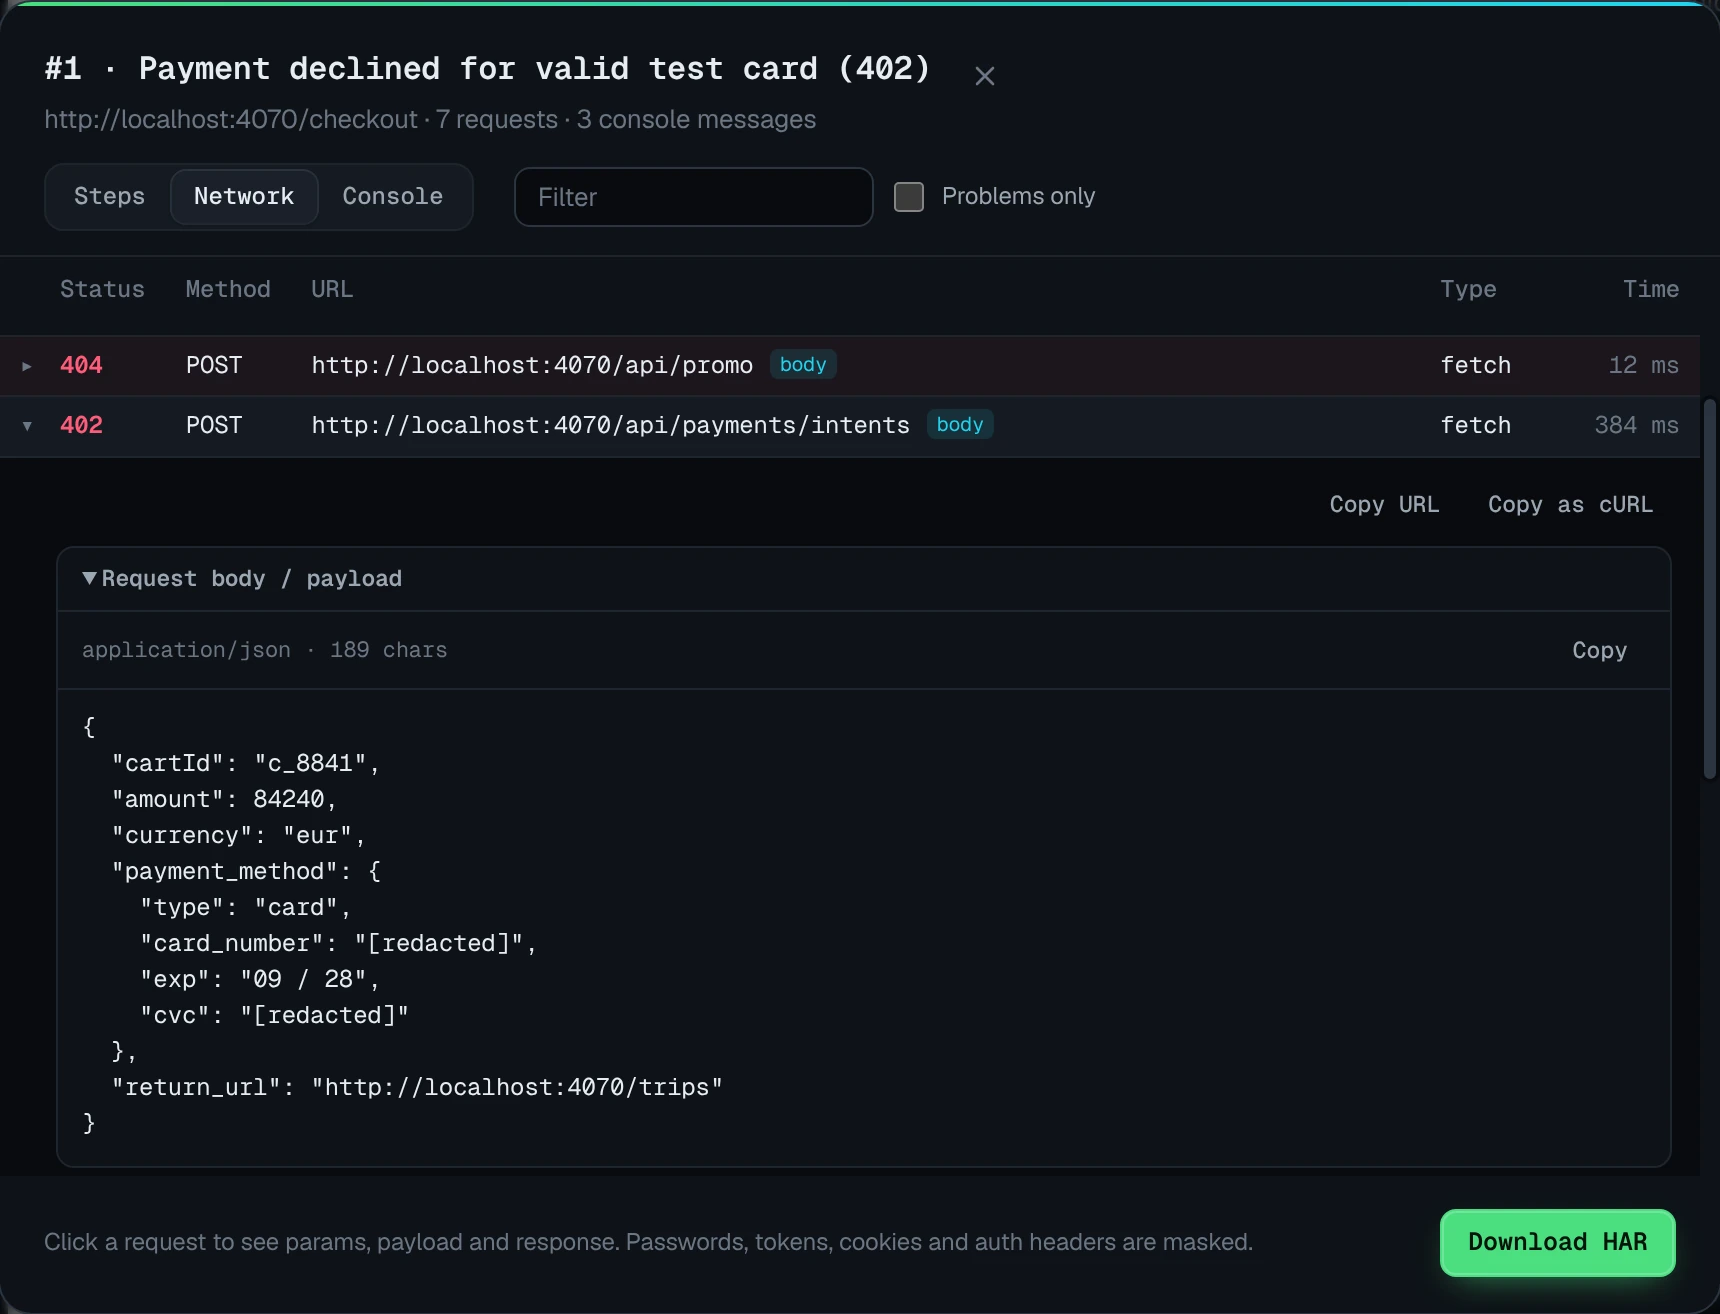
When a web app misbehaves, the answer is usually in a request: a 401, a malformed payload, a response missing a field. Bugmark logs recent network requests in the tab, including payloads and response bodies, and attaches them to every screenshot or recording.
Why the Network panel is not enough for reports
Chrome's Network panel only records while DevTools is open, clears on navigation unless “Preserve log” is ticked, and exporting a HAR is a multi-step process most non-developers have never done. So when a tester says “the save failed,” the one request that explains why was never recorded.
Bugmark works as a network request logger that doesn't depend on anyone remembering to open DevTools. It keeps a rolling log of recent requests in the tab and snapshots it into the report when the bug is captured.
Pairing that log with the screen matters as much as the log itself. A raw HAR from a busy single-page app can hold hundreds of entries with no indication of which one lines up with the error the user saw. In a Bugmark report the requests sit next to the annotated screenshot, the console output and the recorded clicks, so the timeline is clear: the user clicked Save, a PUT went out, a 422 came back, and the UI rendered nothing.
Exactly what is captured
Specific limits matter when you are deciding whether a log will contain what you need:
| Data | Scope | Limit |
|---|---|---|
| Method, URL, status, timing | fetch, XHR and resource requests | Last 150 requests |
| Query params and request headers | fetch and XHR | 60 most recent |
| Request payload (JSON, form data, FormData fields) | fetch and XHR | 60 most recent, up to 16 KB each |
| Response headers and response body (text) | fetch and XHR | 60 most recent, up to 32 KB each |
| Console messages | Tab console, JS errors, unhandled rejections | Last 150 messages |
In practice that covers the API calls of a typical page interaction many times over. Large file downloads or very big JSON responses beyond 32 KB will not be stored in full, so for those you would still reach for DevTools directly.
Working with the log
- Filter to failures to jump straight to 4xx and 5xx responses.
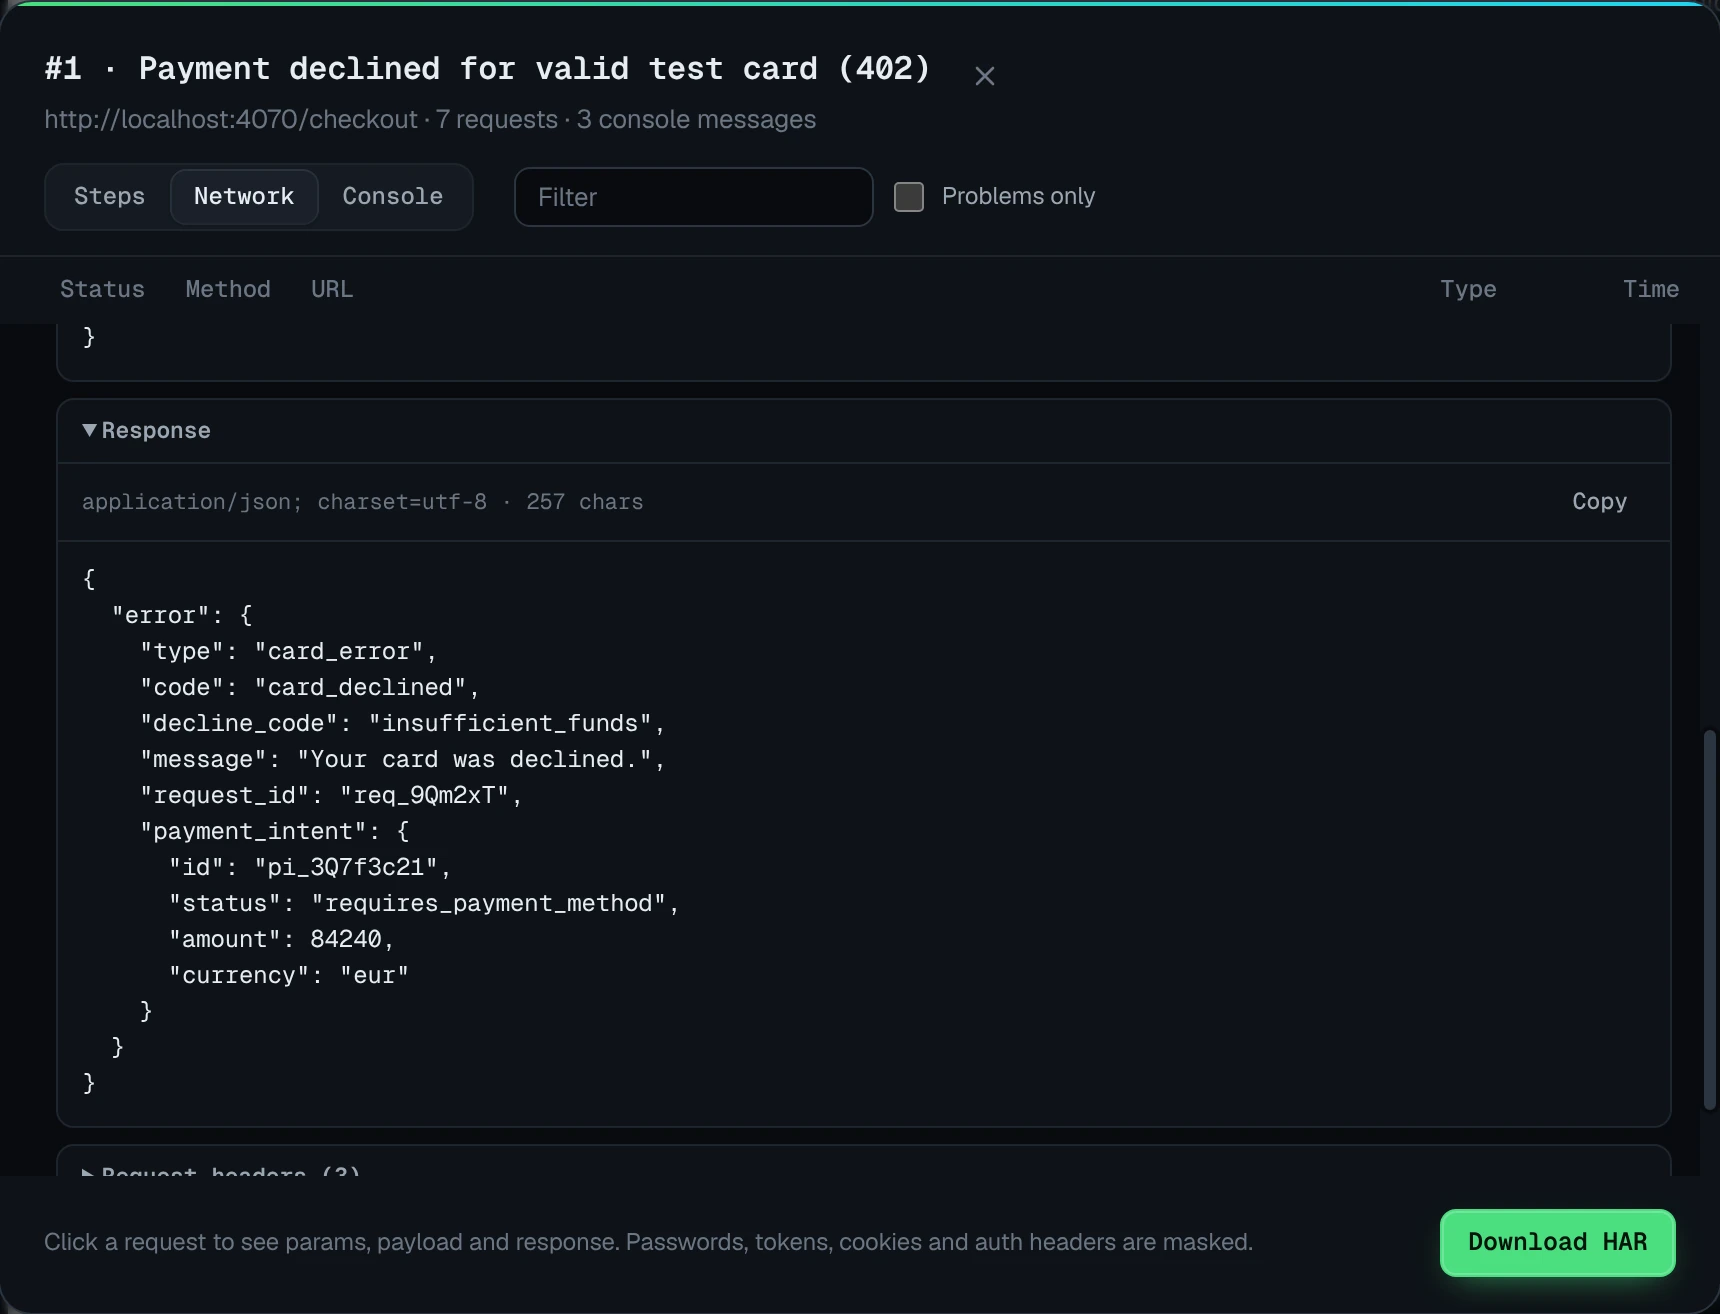
- Per-request detail view with params, headers, payload and response body on separate panes.
- Copy as cURL to replay a request in a terminal, change a parameter, and confirm the fix against staging.
- Download HAR to open the whole log in Chrome DevTools → Network, or share it with a backend engineer who prefers their own tooling.
- GitHub issues include the failing requests in the issue body and commit the HAR file to the
bugmark-assetsbranch.
Want to understand the manual equivalents? See how to capture a HAR file in Chrome and how to capture console logs.
Secret masking before anything is saved
Network logs are the most sensitive part of any bug report. Bugmark replaces passwords, tokens, API keys, session IDs, card numbers and Authorization and Cookie headers with [redacted] in JSON keys, form fields and URL params before the capture is written to storage. Storage itself is local: IndexedDB in your browser, with nothing uploaded to Bugmark servers. The log leaves your machine only when you export a report or create a GitHub issue, and HAR exports come from the already-masked data.
Review before you share
Masking targets common secret patterns. If your API uses unusual field names for sensitive data, open the request detail view and check the payload before exporting a report outside your team.
API request debugging, step by step
- Use the app normally with Bugmark installed; requests are logged in the background.
- When something fails, press ⌥⇧S and capture the screen showing the error.
- Open the Network tab of the capture and filter to failures.
- Read the payload and response body to see whether the client sent bad data or the server returned an error.
- Copy as cURL to reproduce, or download the HAR and attach it to the ticket.
This workflow is especially useful for front-end and backend developers splitting responsibility for a bug: the payload settles whose side it is on. If the request body is wrong, the front end owns it; if the body is correct and the response is an unexpected error, it goes to the API team, with the exact input needed to reproduce it attached. For broader debugging workflows, including unhandled promise rejections, see the debugging tool page.
Limits worth knowing
Bugmark is a logger for bug reports, not a proxy. It does not intercept or modify traffic, mock responses, throttle the connection or inspect traffic from other applications on your computer. It records requests from the Chrome tab it runs in, and the log is a rolling window rather than a complete history of your session. It runs in Chrome and Chromium browsers only. For deep inspection of your own traffic, DevTools or a dedicated proxy is the right tool; Bugmark's job is making sure the evidence exists when someone else hits the bug. Because the window is rolling, capture soon after the failure; on a chatty page that polls an API every few seconds, the relevant request can scroll out of the 150-request log if you wait several minutes.
Capture requests with every bug report
Free, no account, data stays on your device. Works in Chrome, Edge, Brave and Arc. Add Bugmark to Chrome — free.
Frequently asked questions
How do I capture network requests in Chrome?
Open DevTools, go to the Network panel, tick Preserve log and reproduce the issue; you can then export a HAR file. To capture requests without DevTools open, use an extension like Bugmark, which logs the last 150 requests in the tab and attaches payloads and responses to each bug report.
What is a HAR file?
A HAR (HTTP Archive) file is a JSON-formatted record of network requests made by a browser, including URLs, headers, timings and often bodies. Developers use it to analyze failed or slow requests. Bugmark can download captured network logs as a HAR file, which you can import into the Chrome DevTools Network panel.
Does Bugmark capture request and response bodies?
Yes, for fetch and XHR requests. The 60 most recent include query params, request headers, the request payload up to 16 KB, response headers and the text response body up to 32 KB. Older and resource requests in the 150-request log keep method, URL, status and timing.
Is it safe to share network logs in a bug report?
It can expose secrets if not handled carefully. Bugmark masks passwords, tokens, API keys, session IDs, card numbers and Authorization or Cookie headers with [redacted] before saving, and stores reports locally. Still review payloads with unusual sensitive field names before sharing a report outside your team.
Can I copy a captured request as cURL?
Yes. Open any request in a Bugmark report and use Copy as cURL. This gives you a command you can run in a terminal to replay the request, tweak parameters or headers, and verify a fix against a local or staging server. Masked values will need to be replaced with valid credentials.
Try Bugmark free — no account needed
- Screenshots & screen recording
- Console & network logs
- Steps to reproduce
- GitHub issues & reports