web debugging tool
A browser debugging tool for the bugs you can’t reproduce
The hardest bugs are the ones that vanish when you open DevTools. Bugmark records the evidence at the moment the problem appears — the JavaScript errors, the failing API response and the clicks that led there — so debugging starts from facts.
Debugging starts with evidence, not reproduction
Classic debugging advice says reproduce first. That works for deterministic bugs on your own machine. It falls apart for a race condition that shows up on a slow connection, a feature flag enabled for one account, a stale cache, or a 500 from an upstream service that recovered ten minutes later. “Cannot reproduce” is often the honest answer, and the ticket is closed with the bug still live.
A web debugging tool that runs where the bug happens changes the order of operations. Instead of trying to recreate the state, you read what the browser logged when the state was wrong. Bugmark does that as a Chrome extension: it keeps a rolling record of console output, network traffic and user actions in the tab, and freezes it into a report the instant someone captures the problem.
The signals Bugmark preserves
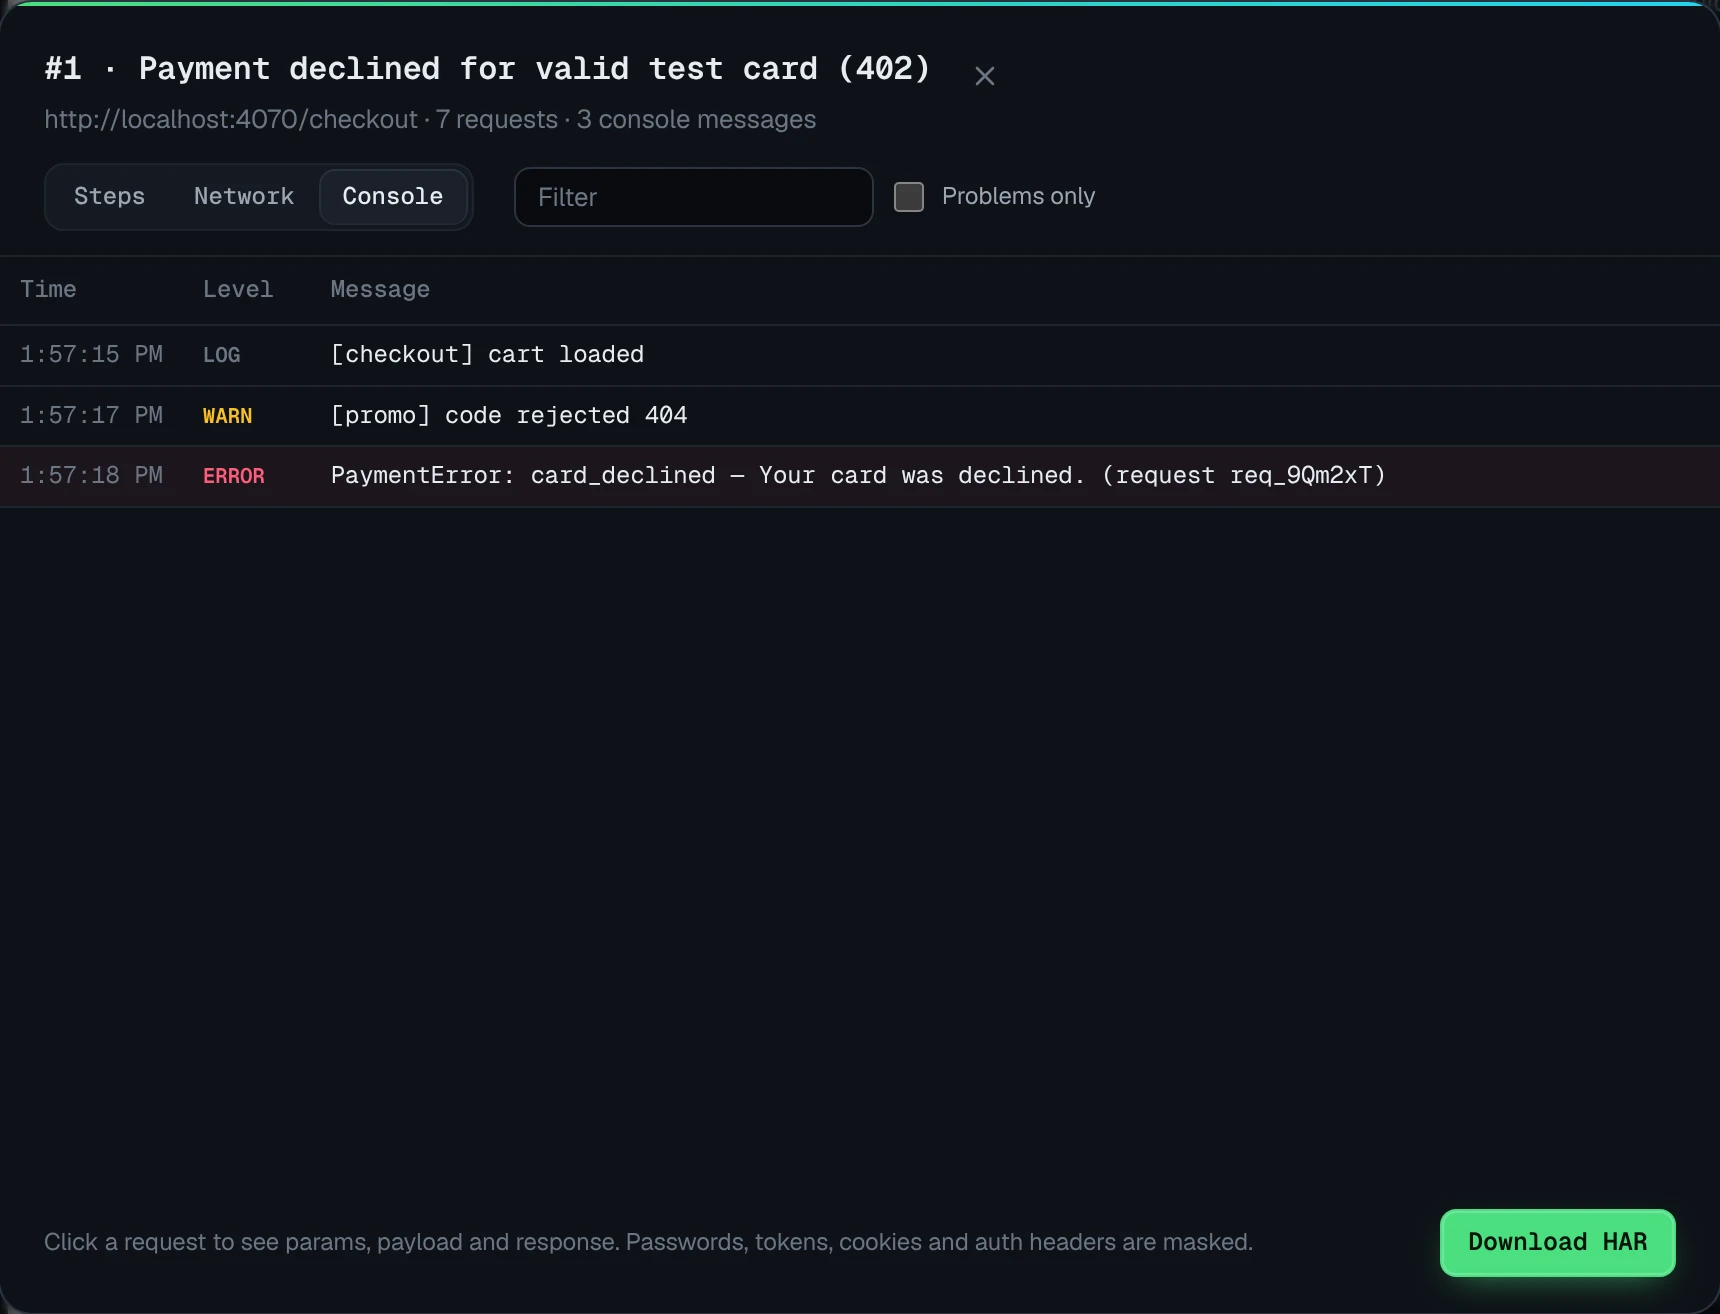
- JavaScript errors and unhandled promise rejections, alongside the last 150 console messages. An
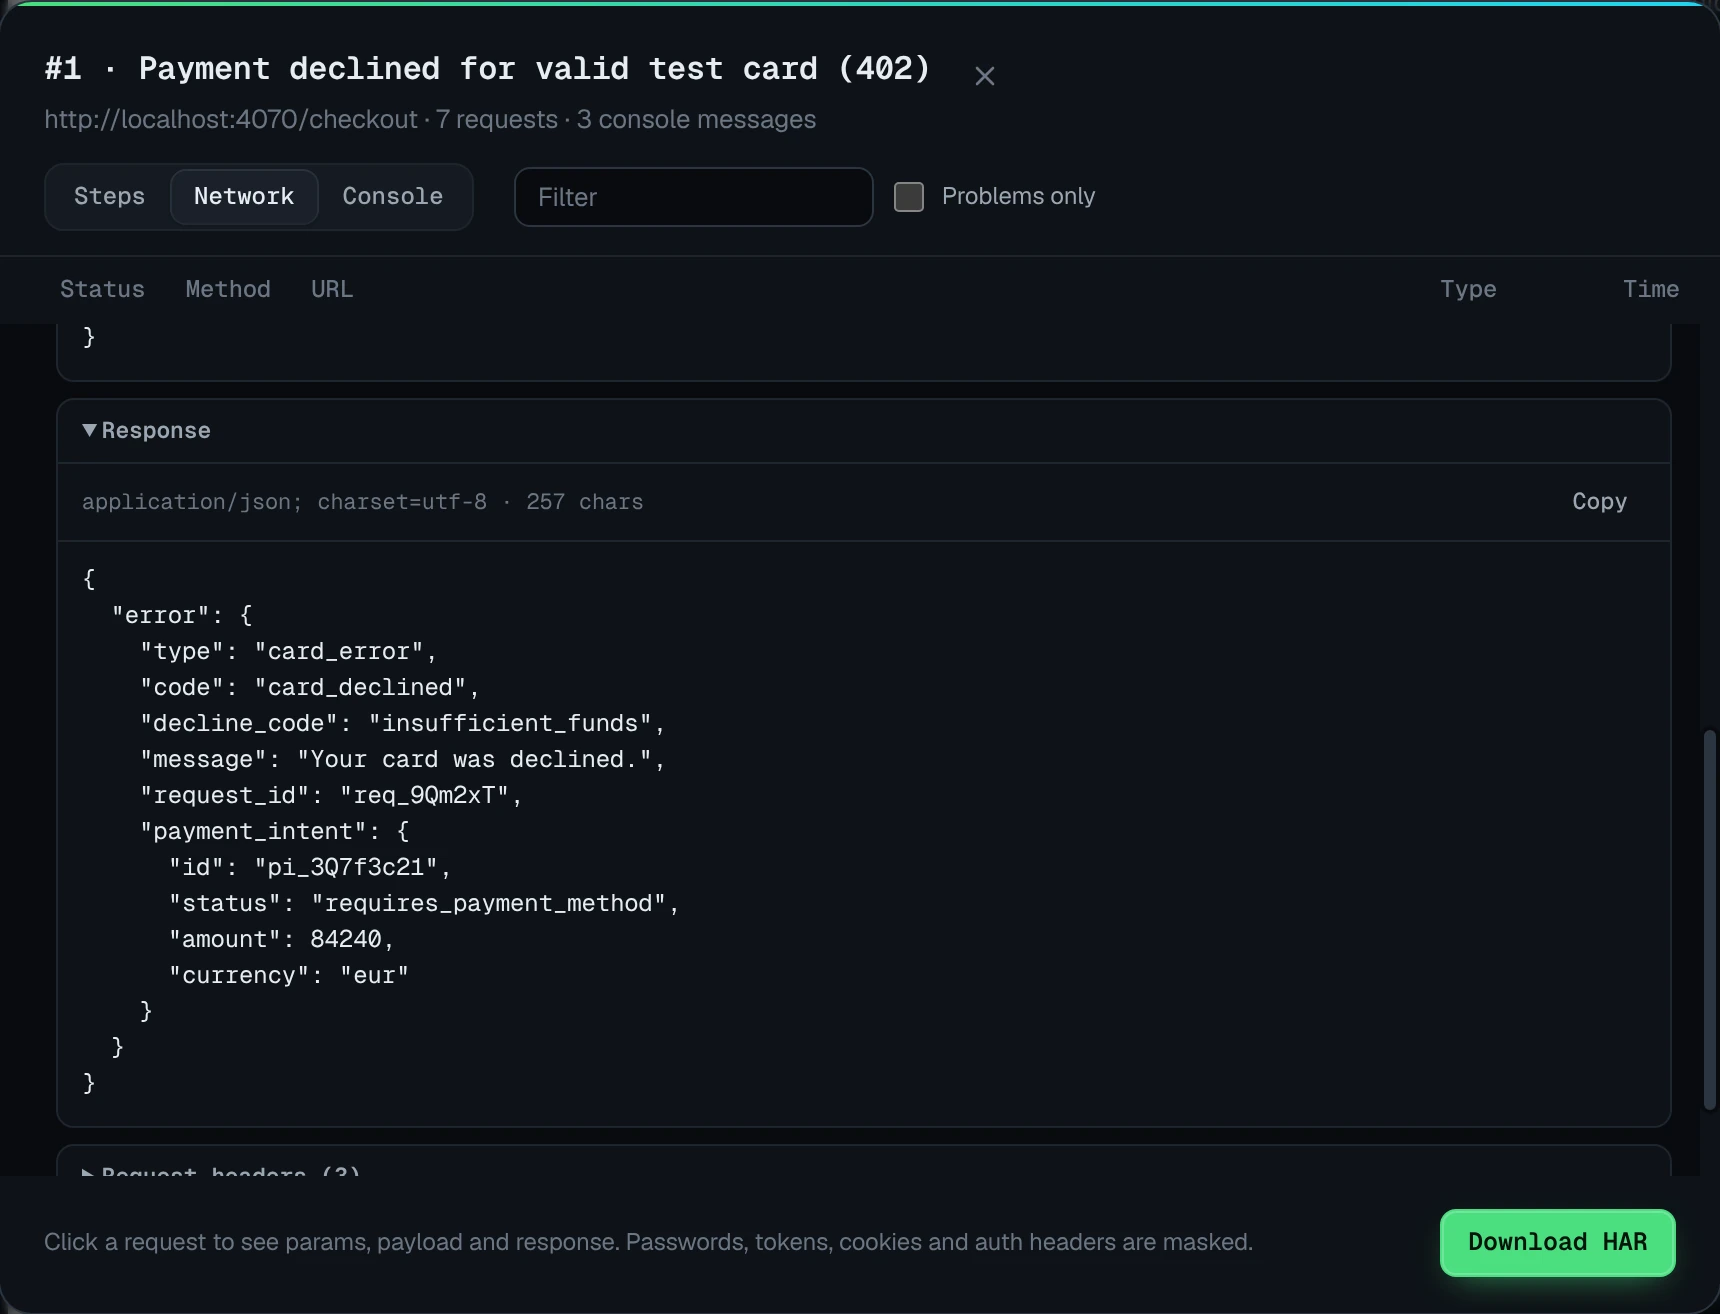
awaitthat threw with nocatchoften produces no visible UI change at all; here it appears in the log. - The last 150 network requests, with status and timing. Filter to failures to see the 4xx and 5xx responses first, then open a fetch or XHR request to read its headers, payload and response body (bodies are kept for the 60 most recent, up to 16 KB request and 32 KB response).
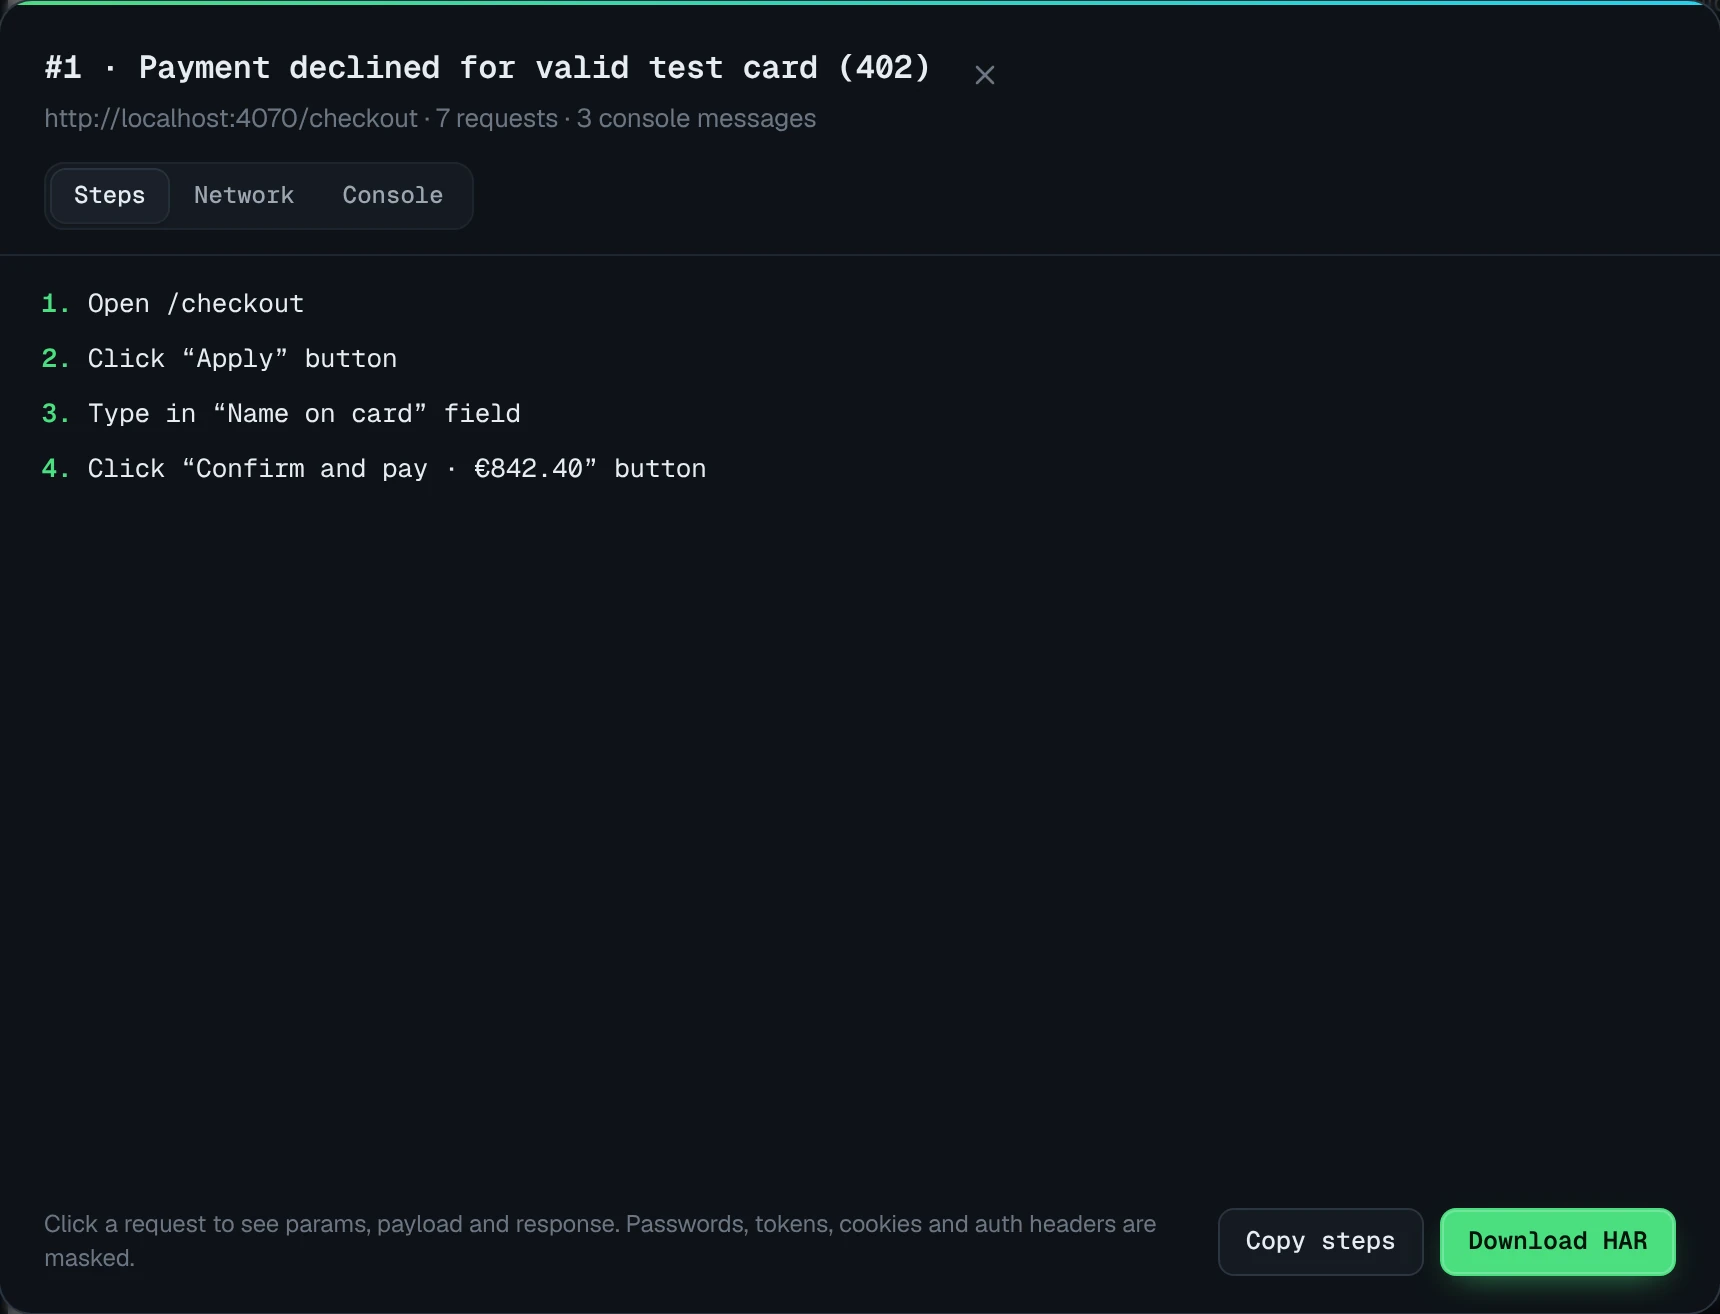
- Steps to reproduce: the last 30 actions, including clicks with element labels, form submits and SPA route changes, which tells you the sequence that led into the broken state.
- Environment: browser, OS, viewport, pixel ratio and scroll position, the variables that most often explain why a bug is intermittent.
Recording intermittent problems
For bugs that happen over several screens, start a recording with ⌥⇧R before walking the flow. Recordings run up to 5 minutes, continue across page loads, and can include microphone narration so the tester can say what they expected at each step. The console and network logs are attached to the recording in the same way as a screenshot. The screen recorder for bug reports page covers this workflow in more detail.
Where Bugmark ends and DevTools begins
Bugmark is a capture tool, not an interactive JavaScript debugging tool. It does not set breakpoints, step through code, watch variables, map minified stack traces back to source, or profile CPU and memory. It does not record every session in the background either: logs are a rolling window of the most recent activity in the tab, and a video only exists if someone pressed record.
The intended hand-off is simple. Use the report to find which request failed and which error was thrown, then download the HAR into DevTools or replay the request with cURL and set your breakpoints there. If you want to collect logs manually for comparison, see how to capture console logs.
Secrets stay out of the logs
Before a report is saved, passwords, tokens, API keys, session IDs, card numbers and Authorization/Cookie headers are replaced with [redacted] in JSON keys, form fields and URL params. Reports stay in local browser storage until you export them.
Who gets the most out of it
Front-end and full-stack developers debugging reports from staging or production. Support engineers who need to escalate with proof. QA testers on exploratory sessions, where the interesting failures are rarely scripted; see the QA testing tool page. And anyone who has closed a ticket as “cannot reproduce” and suspected the bug was still there.
Debug from what actually happened
Bugmark is free, needs no account and keeps data on your device. It works in Chrome, Edge, Brave and Arc. Add Bugmark to Chrome — free.
Frequently asked questions
How do I debug a website in Chrome?
Open Chrome DevTools with F12 or Ctrl+Shift+I (Cmd+Option+I on Mac), check the Console for errors, then use the Network panel to find failed requests and the Sources panel to set breakpoints. When the bug happened on someone else’s machine, a capture tool like Bugmark gives you those logs from their session.
How do you debug a bug you cannot reproduce?
Collect evidence from the moment it occurred instead of recreating it: the console errors, failed network requests with response bodies, the exact sequence of user actions and the environment. Bugmark records these in the background and attaches them to a screenshot or recording, which usually reveals the missing condition.
Does Bugmark capture unhandled promise rejections?
Yes. Along with the last 150 console messages, Bugmark records JavaScript errors and unhandled promise rejections. These are common causes of buttons that silently do nothing, because the error never reaches the interface, so having them in the report saves a lot of guesswork.
Can Bugmark set breakpoints or step through JavaScript?
No. Bugmark is not an interactive debugger. It captures console output, network traffic, user steps and environment details for a report. To step through code, export the HAR or copy a request as cURL, reproduce the failing case locally, and use the Sources panel in Chrome DevTools.
Does Bugmark record every session automatically?
No. It keeps a rolling window of recent tab activity: the last 30 actions, 150 console messages and 150 network requests, attached when you capture. Video is only recorded when you start a recording. Bugmark does not offer replay of past sessions that were not recorded.
Try Bugmark free — no account needed
- Screenshots & screen recording
- Console & network logs
- Steps to reproduce
- GitHub issues & reports